What is a hammer candlestick?
A hammer candlestick appears at the end of a downtrend and signals a potential reversal. Imagine a stock that has been dropping for several days. Sellers are in control, pushing the price lower with each session.
Suddenly, you see a candle with a long lower shadow and a small body at the top. This tells you that sellers tried to push the price further down but lost momentum as buyers stepped in and pulled the price back up before the session ended.
The long lower shadow represents how far the price fell before buyers took control. The small body shows that the price closed near where it opened, indicating that buyers had the upper hand by the end of the session.
Key features
- Small body near the top, with no preference for color (green or red can both work).
- Long lower shadow (at least 2x the body length).
- Minimal or no upper shadow.
- Forms after a downtrend.
Anatomy of a hammer candlestick
Identifying a hammer candlestick requires understanding its anatomy. Let’s dissect its three main components.
- Body: The hammer’s body is small, usually making up about one-third or less of the total candle length. It can be bullish (green/white) or bearish (red/black) and sits at the upper end of the trading range, indicating limited downward movement by the close.
- Upper Shadow: The upper shadow is either very small or nonexistent. If present, it should not exceed the length of the real body. A minimal upper shadow shows sellers had little control over the candle’s close.
- Lower Shadow: The lower shadow is the defining feature of a hammer. It is typically two to three times the length of the real body, showing that buyers regained control after significant downward pressure, pushing prices back up before the candle closed.
The psychology of the hammer candlestick
The hammer candlestick tells a simple story of fear, opportunity, and confidence shifting in the market. It starts with panic selling, where traders rush to get out, driving prices lower. But just like a flash sale in a store, lower prices eventually attract buyers looking for a deal. The long lower shadow of the hammer represents that moment when selling pressure exhausts itself, and buyers step in aggressively to push prices back up.
This shift in sentiment can often lead to a trend reversal, but confirmation is key. Just as a good deal doesn’t always mean an item will stay in stock, a hammer alone isn’t a guaranteed reversal signal. Strong follow-through in the next few candles strengthens the case that buyers are firmly in control.
Trading the hammer candlestick
Knowing what a hammer candlestick looks like is one thing, but trading it effectively is where the real skill comes in. Here’s a step-by-step guide to make the most of this pattern.
1. Identify the right location
The hammer is most reliable when it forms after a clear downtrend or during a pullback in an uptrend.
- After a Downtrend: This is where the hammer shines, signaling a potential reversal at the end of a prolonged sell-off when sellers have run out of steam and buyers begin to step in.
- During Retracements: Sometimes hammers appear during pullbacks in an overall uptrend. For example, if an asset is trending higher and experiences a temporary dip, a hammer at the bottom of that dip may indicate the trend is ready to continue upward.
For added reliability, look for hammers near strong support zones, long-term demand levels, or key moving averages like the 200 EMA. It is best to avoid trading hammers in sideways markets or during random price movements.
Pro Tip: Tall hammers (with longer lower shadows) tend to perform better than short hammers.
2. Entry
Trading a hammer candlestick pattern requires a balance between aggression and patience. Two primary approaches exist, each suited to different market conditions and trader preferences.
- Conservative Entry: The conservative entry waits for confirmation after the hammer forms. This approach sacrifices some potential profit for higher reliability. Wait for the next candle to break above the hammer’s high, then enter with a limit order slightly below the breakout point. This method reduces false signals but often results in a wider stop loss.
- Aggressive Entry: The aggressive entry involves taking positions near the hammer’s close or on a pullback to its midpoint. While this provides better risk-reward ratios, it carries a higher risk of failure. Only use this approach when the hammer forms with exceptional volume and strong support confluence.
Combine the hammer candlestick with tools like EMAs, RSI, MACD, or support and resistance levels for higher accuracy. An oversold RSI or a bullish divergence can confirm that the asset is primed for a reversal, making the hammer more reliable.
Similarly, a bullish MACD crossover indicates that momentum is shifting in favor of buyers, adding extra confidence to your trade.
3. Stop loss placement
Once you’ve entered a trade, protecting your capital is essential. That’s where stop-loss placement comes in. Here are key considerations for stop placement:
- Market volatility (wider stops in volatile conditions)
- Nearby support levels
- Average true range (ATR)
- Recent price swings
Avoid setting your stop loss at obvious levels like recent swing lows. These areas often get hunted by stop-loss orders. Instead, place your stop a little below that level to reduce the chances of being taken out prematurely. Aim for 1.5x the ATR value for a balanced stop distance if you’re using ATR.
4. Target (Booking profits)
Profit targets should align with market structure rather than arbitrary ratios. Look for major resistance levels where sellers might step in:
- Previous swing highs
- Key Fibonacci retracements (38.2%, 61.8%)
- Round numbers
- Trend lines or moving averages
Aim for the next resistance level. Use a risk-reward ratio of at least 1:2. If the market shows strong momentum, you can aim for a higher target.
5. Position sizing
Position size must reflect both the stop loss distance and overall market conditions. Never risk more than 1-2% of your trading capital on a single hammer trade. Calculate position size based on the following:
To know your position size, divide your total risk by the stop-loss distance:
Position Size = Risk Amount / Stop-Loss Distance
In this example: ₹200 (risk) ÷ ₹5 (stop) = 40 shares.
You must take only 40 shares if your stop loss is coming ₹5. You can add more shares if your stop loss is low.
Pro Tip: Never increase your position size just because a setup looks “perfect.” Stick to your predefined risk management rules if you want to survive long in the market
6. Trade management
When the trade moves in your favor, consider these adjustment strategies:
- Break-even stop: Move your stop to entry when the price reaches 1:1 risk-reward. This protects against sudden reversals while allowing for larger gains.
- Trailing stop: As the price advances, gradually move your stop below recent swing lows. This locks in profit while giving the trade room to develop.
- Scale-out approach: Consider taking partial profits at key resistance levels while letting a portion run for larger gains.
Be flexible with your strategy. Sometimes, it’s better to lock in smaller profits rather than wait for the perfect target. Letting a winner run is great, but don’t let greed wipe out your gains.
7. Exit conditions
Knowing when to exit is just as important as finding a good entry. A clear exit plan removes emotions from decision-making and helps you manage risk effectively. Here are some valid reasons to exit include:
- Price reaching your predetermined target
- Break of trailing stop
- Formation of opposing price patterns (i.e., Higher high to lower low)
- Loss of momentum on higher timeframes (Multiple Base candles)
Real-world examples of hammer candlestick

This 15-minute Natural Gas chart shows a clear downtrend that reverses at a key support level. Initially, the price dipped below the support, triggering stop losses for early buyers. However, it quickly recovered and closed back above the support level.
This price action formed a hammer candlestick, a reliable sign of a possible reversal. The long lower wick reflects how sellers attempted to push the price lower but failed, while buyers regained control and drove the price back up.
Following the hammer, a series of strong green candles confirmed the shift in momentum. Traders could enter at the close of the hammer or wait for the next green candle for additional confirmation.
Risk management is critical here—placing a stop loss just below the hammer’s low limits potential downside. For targets, aim for at least a 1:2 risk-reward ratio. It’s wise to take partial profits at key resistance levels, such as a gap zone in this chart.
Once the price reaches a 1:1 ratio, moving your stop loss to break even helps secure gains while leaving room for further upside.
Let’s look at another example with the RSI Confluence:
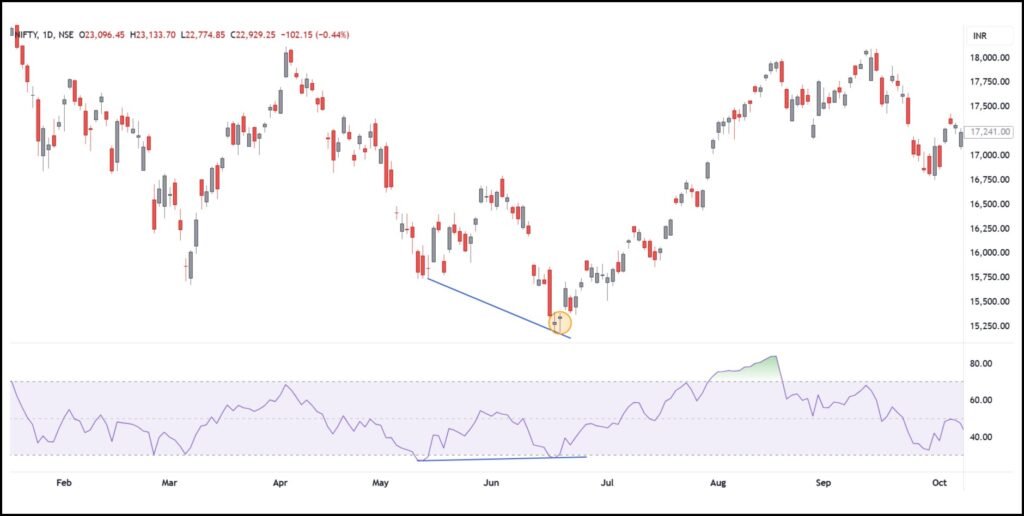
This daily chart of Nifty50 shows a bullish divergence between the price and the RSI. While the price made a lower low, the RSI printed a higher low, signaling that bearish momentum was weakening. Divergences like this can act as early warnings for potential reversals.
What strengthens the signal here is the candlestick pattern that formed at the same point—a combination of a Morning Star and Hammer pattern. These patterns, especially when they appear together, indicate a possible trend change.
The market responded accordingly, with the price reversing and a series of green candles pushing it higher. This confluence of bullish divergence and candlestick patterns provided a clear trade setup with a high probability of success.
Related: How to get rid of FOMO in trading
Performance of hammer candlestick pattern
According to the Encyclopedia of Candlestick Charts, the hammer candlestick pattern has a decent success rate but is not a guaranteed reversal signal. In a bull market, it has a 60% chance of leading to a bullish reversal, while in a bear market, that probability drops slightly to 59%.
Higher timeframes like the daily and weekly charts provide the most reliable signals. Trading hammers on these timeframes reduces noise and avoids the constant fakeouts seen on lower timeframes.
If you trade intraday, focus only on hammers that form at key levels such as major support zones, previous day lows, or psychological levels. This prevents unnecessary stop-outs and keeps you in high-probability setups.
Difference between hammer, hanging man and doji candlestick pattern
When a hammer appears in a downtrend, it’s known as a hammer and signals a potential bullish reversal. On the flip side, when the same candle shows up in an uptrend, it’s called a hanging man, often indicating a bearish reversal. While both patterns look identical, their meaning depends entirely on their trend.
A doji, however, is quite different. It forms when the opening and closing prices are nearly the same, creating a small or non-existent real body. It signals indecision in the market and can either confirm a trend continuation or hint at a reversal, depending on what follows next.
To make it clearer, here’s a quick table comparing hammer, hanging man, and doji patterns:
| Feature | Hammer | Hanging Man | Doji |
|---|---|---|---|
| Trend Appearance | Downtrend | Uptrend | Both uptrend and downtrend |
| Signal Type | Bullish Reversal | Bearish Reversal | Potential Reversal or Indecision |
| Candle Body | Small (near the top of the range) | Small (near the top of the range) | Extremely small or non-existent |
| Upper Shadow | None or very small | None or very small | Small, large, or absent |
| Lower Shadow | Long (2-3 times the body) | Long (2-3 times the body) | Varies; typically balanced shadows |
| Confirmation Needed | Yes (next candles should confirm reversal) | Yes (next candles should confirm reversal) | Yes (confirmation helps clarify direction) |
| Common Interpretation | Buying pressure is increasing | Selling pressure is increasing | Market uncertainty or potential trend change |
Common mistakes to avoid when trading hammer pattern
Now that you have a solid plan for entering and exiting trades, let’s look at some common mistakes traders make—and how to avoid them.
- Ignoring Context: Trading a hammer without considering the overall trend or key levels like support zones or moving averages can lead to losses. Hammers work best after a downtrend or during a pullback, not in sideways or choppy markets.
- Skipping Confirmation: Jumping in right after spotting a hammer is risky. Always wait for a bullish candle to close above the hammer’s high. This confirms the reversal and reduces the chances of false signals.
- Poor Stop-Loss Placement: Placing your stop too close can result in getting stopped out by minor market moves. If your stop is too far, you risk losing more than necessary. The ideal stop is just below the hammer’s low or at the most recent swing low if you enter on a retracement.
- Overloading on Indicators: Using too many indicators makes decision-making harder. Stick to one or two that fit your style. RSI can help spot oversold conditions, while MACD shows momentum shifts. Too many signals can lead to analysis paralysis.
- Ignoring Volume: Volume is a key factor in confirming the strength of a hammer. Hammers with high volume are more reliable, while low-volume hammers may be market noise. Check how the volume compares to recent candles.
- Overtrading the Pattern: Some traders become fixated on hammer patterns, trying to trade every one they see. This leads to overtrading and diminishing returns. Not every hammer needs to be traded. The best opportunities come when multiple factors align perfectly.
Summary checklist
To trade the Hammer effectively:
- Identify a downtrend or a retracement in an uptrend.
- Spot a Hammer with a long lower wick and small body.
- Wait for bullish confirmation (next candle or volume spike).
- Enter above the Hammer’s high.
- Set a stop-loss below the Hammer’s low.
- Target a reasonable take-profit level based on nearby resistance or risk-reward.